***The following project presents a Python Add-in Customized Toolbar using ArcGIS 10.1 and 10.2 for the purpose of managing and extracting datasets into sub datasets for use in specific projects. If you would like a copy of the toolbar, please contact me and I’ll provide you a copy***
Introduction
A significant portion of analysis is organizing and structuring data in a usable format. Efficient organization of data takes much time and preparation to ensure all data falls strictly within the bounds of an Area of Interest (AOI) and has a comprehensive data structure. With this in mind, a python add-in module can be created to automate many of these repeatable tasks to manage data and cut down time searching for functional features per analyses.
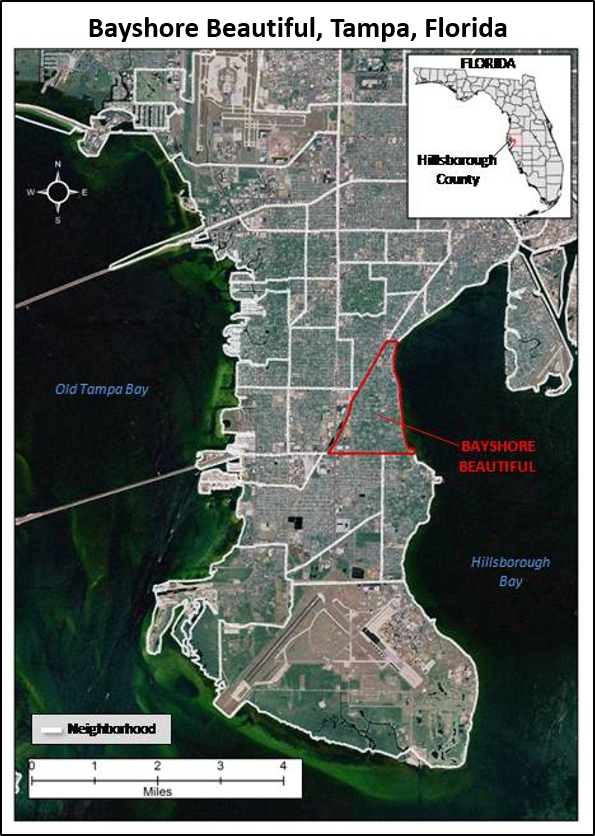
I created a test scenario which involves South Tampa in Hillsborough County, Florida (Figure 1) and managing data elements that fall within a specific neighborhood, Bayshore Beautiful. The AOI will then be further extracted by elevation values of 0-3 feet. General purposes for this test scenario include understanding what features of the neighborhood lie in areas of 0-3 feet which may have a higher chance to flood.
Model Inputs and Data Gathered
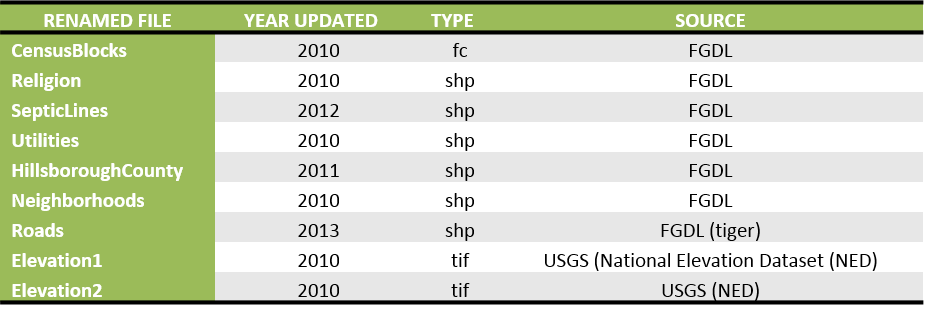
The input data selected for this scenario includes free raster and vector data. In addition to elevation rasters from USGS, various shapefiles from the Florida Geospatial Data Library (FGDL) were selected to build up a preliminary dataset for Hillsborough County, Florida (Table 1).
To set up this test scenario, the raw data was all projected to NAD 1983 StatePlane Florida West FIPS 0902 and clipped to an area in Hillsborough County known as South Tampa using two simple models in ArcGIS’s ModelBuilder (separate iterators for rasters and shapefiles) (Figure 2). The purpose of this is to represent a formal database. Names of the layers were also changed to be intuitive and features classes were extracted to shapefiles. The shapefiles include points, lines, and polygons and are used to show various features within the study area. They do not represent all features that could be found in the AOI, but are used as sample features in the test case scenario.

Methodology and Implementation
The purpose for this tool is to automate extracting data from a larger dataset. A python add-in is created and installable for a user to create datasets based on specified boundaries. Figure 3 shows the flow over the five python add-in components utilizing an extension and a toolbar with four buttons.

If installing the add-in, ensure the extension is checked (Customize>Extensions>Valenti Add Base Layer), and a new MXD should be opened. For the test case of South Tampa, the extension is used to present the base layer containing the neighborhoods for South Tampa when a new MXD is opened.
The Python Add-in uses the toolbar component which contains four buttons all created in python: Zoom to Selected Features, Copy Selected Features, Extract Data from Workspace, and Create Subset by SQL Query. The Zoom to Selected Features button is written in the add-in script while the last three buttons are python scripts that were added to a toolbox and used in the add-in script using the function GPToolDialog (Listing 1) so parameters may be used.

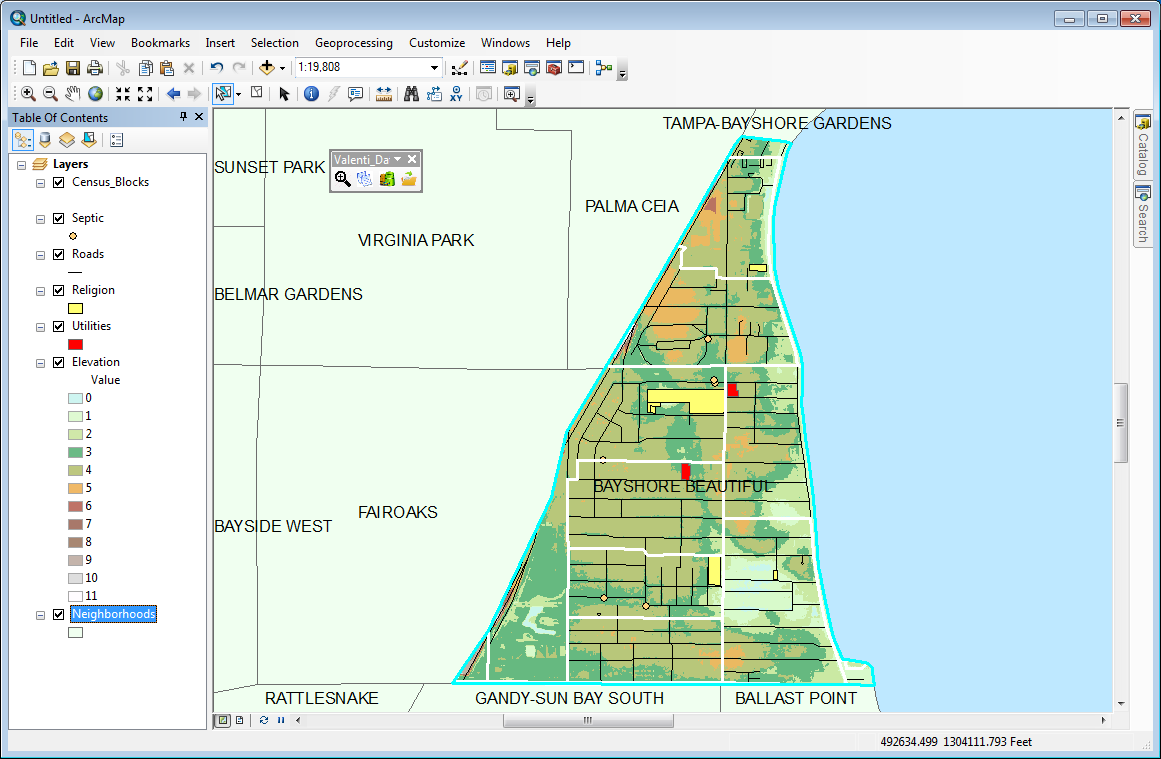
The explanation of the flowchart is as follows: a user will select an area, i.e. Bayshore Beautiful neighborhood from the South Tampa neighborhoods shapefile and click the ‘Zoom to Selected Features’ button to zoom (Figure 4).

The next button is ‘Copy Selected Features’ which exports the selected feature to a new shapefile. For example, the selected neighborhood, Bayshore Beautiful (in Figure 4) is exported to a new shapefile.
To find all usable data that pertains to the new AOI of Bayshore Beautiful, the third button, ‘Extract Data from Workspace’, should be used. While this script runs, it is creating two new geodatabases (scratch and working), looping through a workspace (folder) for vector then raster layers and clipping them to the AOI. The layers are imported to the geodatabase and the rasters are mosaicked.
The output is a scratch geodatabase containing the clipped elevation rasters, and a working geodatabase with the mosaicked elevation raster, census blocks, religion, septic lines, utilities, and roads all clipped to Bayshore Beautiful bounds (Figure 5).
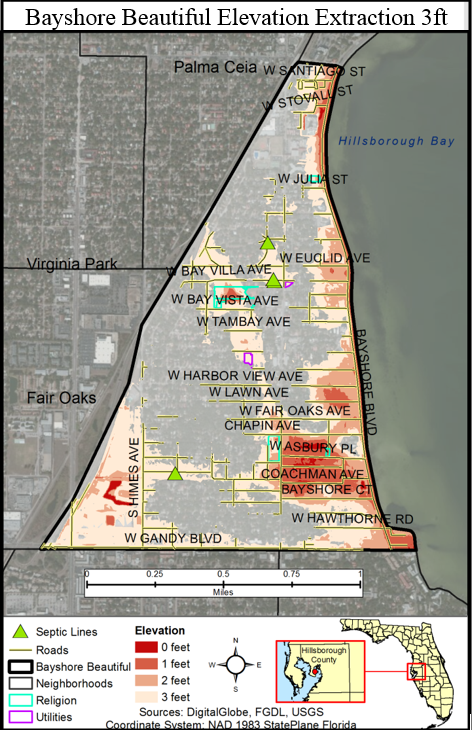
The final button creates a feature dataset within the previously created geodatabase, performs a SQL query on a raster dataset which creates a new raster, and clips all feature classes by the boundaries of the new raster to the feature dataset. In the test scenario, the new raster dataset is called Elevation3ft, the attributes of 0-3 feet are extracted from the Elevation raster in the geodatabase, and the feature classes within the geodatabase are clipped to the elevation boundaries that are within 0-3 ft. The purpose for this can be to create a subset dataset to understand which features are affected by having a low elevation and may be privy to flooding (Figure 6).
Conclusion and Noticed Issues if Creating your Own Add-in
While creating this python add-in customization, issues were encountered through compatibility differences noticed in ArcGIS 10.1 and 10.2. In version 10.1, the python scripts worked most of the time but would occasionally fail when dealing with the rasters, while in 10.2, they always failed. It was discovered that this was in part due to using parameters as string values when used as a tool in an Arc toolbox. With parameters that used strings as input values, the code was changed to such an example: newRaster = str(arcpy.GetParameterAsText(1)) and across both 10.1 and 10.2, there were no issues.
A second compatibility issue arose with the ability to drag a shapefile from the table of contents in ArcGIS into the script’s dialog box. In 10.1, Neighborhood.shp with the selected feature could be dragged into the ‘Copy Selected Features’ dialog box without issue. In 10.2, however, it was not permissible.
Modeling data exploration and management allows a user to quickly and efficiently manipulate data for more specific uses. The add-in created has the ability to work with any datasets through parameters and for any types of analyses. The extraction of elevation data for South Tampa was used as an initial look into a flood study based on low elevation levels. The customized add-in was useful in finding features that exist in these potential flood zones.
Sources
Florida Geographic Data Library (FGDL), accessed February 24, 2014, http://www.fgdl.org.
US Geological Survey, “National Elevation Dataset 1/9.” Accessed February 24, 2014, http://viewer.nationalmap.gov/viewer/.
